 Supply and Demand in the Stock Market
The Relative Shortage of Equities
Over the long history of the U.S. stock market, price-earnings ratios have averaged around fifteen times earnings. This measure of stock valuation is discussed in the lesson on earnings-based value.
At times, as in the early years following World War II, demand for capital by issuers exceeded funds supplied by investors, forcing price-earnings ratios to below ten.
A measure of the scale of a shortage in equity supply is useful in Capital Flow Analysis.
In other periods, such as the Great Bubble of the 1990s, investors' determination to buy equities exceeded issuers willingness to to satisfy their demand for stocks, pushing price-earnings ratios well above twenty.
In fact, during the Great Bubble, issuers competed with investors in buying back company shares, contributing to the shortage.
In order to better interpret fund flows, it is useful to have an estimate of the scale of periodic shortages and excesses in equity supply.
In the essay, "The Hidden Shortage", this question is discussed at length.
Disturbances That Move Markets
The larger the market, the greater the scale of disturbances in supply and demand that are required to move prices.
- In the incipient Brazilian market of the 1950s, daily trading on the Rio de Janeiro stock exchange was sometimes as low as US$25,000. An underwriting of just a few million dollars could keep price-earnings ratios below ten.
- In contrast, the emerging Indonesian market of 1988-89 attracted several billion dollars in international funds, creating demand far greater than issuers could supply, driving price-earnings ratios above twenty for unseasoned companies.
Measuring the Supply of Equities
The supply of investment grade equities is a function of total profits of all companies that are willing to issue shares in the public market.
Say, for example, that total profits of all public companies are ten billion dollars. At fifteen times earnings — the expected long-term equilibrium level — total market value of equities would be $150 billion.
Long-term average price-earnings ratios serve as a way to measure supply and demand for equities.
If we observe, however, that total market value has risen to $300 billion (30 times earnings), this would suggest that another ten billion dollars in profits would be necessary for average price-earnings ratios to drop to fifteen.
In other words, if issuers were to offer another $150 billion in new issues at fifteen times earnings, the total market capitalization could be $300 billion at fifteen times earnings.
The difference between actual market value and the value of the market based on total earnings times fifteen can serve as an indicator of the shortage or excess of equities.
The Equity Supply Indicator
Using the national flow of funds accounts, we calculate the Equity Supply Indicator as the difference between total after-tax profits of nonfarm nonfinancial corporations (Flow Table F.213) multiplied by fifteen, and the total market value of the equity of this same group of corporations (Level Table L.213).
Total corporate profits is the key number.
When this value is positive, we can say there seems to be an excess in the supply of equities and that issuers are anxious to raise more funds than investors can supply.
A negative value indicates a shortage of equities, suggesting that investor demand exceeds the supply of equities.
Correcting Supply/Demand Disequilibrium
A shortage of equities may be corrected either by new issues (backed by profits) or by a fall in prices (indicating a diminishing of demand).
An excess of equities may be corrected either by decreased profits or the entrance of new investors that drive prices upwards.
The Equity Supply Indicator, measured in trillions of dollars for the U.S. market, serves as a rough gauge of the degree of imbalance of supply and demand as measured by the long-term central tendency of price-earnings ratios.
The Shortage of Equities
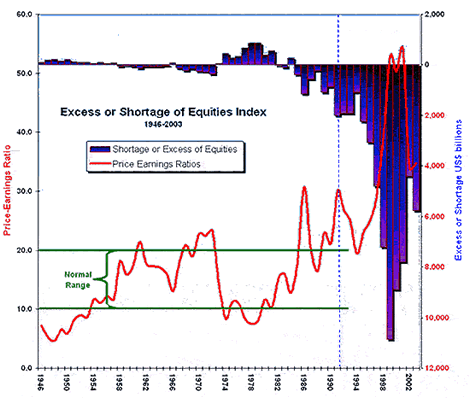
The graph shows how this indicator has performed over the period 1946-2003:
 After 1992, the shortage of equities exceeded two trillion dollars.
From the graph we note that until the 1980s, the market was more likely to see a shortage of demand (investors) than a lack of supply (issuers).
However, from 1985 on, as the corporate stock buyback movement accelerated and as investors continued to invest at any price through mutual funds, the shortage of equities reached the extreme levels of the Great Bubble.
The price-earnings ratio used to calculate this index (shown on the chart) is also derived from the flow of funds accounts and shows greater extremes than the price-earnings ratio based on the Standard & Poor's 500 Index (as used in the essay, "The Hidden Shortage")
Measuring Supply-Demand Imbalance
Although the Equity Supply Indicator is only a rough estimate of the scale of a shortage or surplus of equities in the market, it is useful as a relative gauge in comparing the degree of market imbalance and the likelihood of the various alternate ways by which this imbalance might be corrected.
For example, the shortage during the Great Bubble, even after the sharp correction in prices of 2000-2001, was on the order of several trillion dollars.
To correct a shortage of equities, either profits must rise or prices fall.
Because U.S. corporation have been engaged in long-term decapitalization through buyback programs and because the long-term rate of growth of profits for the entire market is only 5.3%, it would seem to be extremely unlikely that corporate America could increase profits fast enough to earn its way out of the hole.
The other way of correcting the imbalance, a fall in prices, seems more likely, especially with the looming liquidation of retirement funds by Baby Boomers which is expected to begin within a decade.
Before proceeding, check your progress:
Self-Test
In this lesson, the supply of equities is related to:
|
|
Following World War II, the demand for capital by issuers resulted in :
|
|
After 1992, the U.S. capital market was driven by:
|
 learning module : End

