Investment Tutorial: Flow of Funds  : Continued
Federal Reserve Flow of Funds Table Coding
Table Coding System
It is easier to find your way around Federal Reserve Release Z.1 if you understand the system used to code the tables that make up this statistical series.
The rules are simple:
Flow Tables: All flow tables are coded with the letter F, such as F.100 or F.213.
Level Tables: All level tables are coded with the letter L, such as L.100 or L.213.
Sector Tables: All sector tables are in the 100 series of numbers, such as F.102, L.123, or F.114.
Instrument Tables: All instrument tables are in the 200 series of numbers, such as F.208 or L.217.
All flow tables on this site are marked with their Federal Reserve codes, making it easy to identify tables that refer to sectors and instruments.
There are no level tables on this site, but direct links to Release Z.1 are included with the relevant flow tables.
The Official Guide to the Flow of Funds Accounts
The Federal Reserve publishes official definitions for each of these tables in its 'Guide to the Flow of Funds Accounts'.
A detailed technical explanation for each line item in the flow of funds accounts is found in this guide.
The Guide may be purchased from the Federal Reserve Bank for $20.
Excerpts from the official guide for the thirty tables included on this site are published on the definition page associated with each color-coded table.
Net Flows vs. Total Transactions
The flow of funds accounts do not show total transactions.
Instead, flow tables only shows net transactions with respect to sectors and instruments.
For example, households may write checks causing trillions of dollars in transfers of demand deposits between banks, but the flow of funds statistics will show only the net change in deposit balances for that sector over the period.
From the point of view of Capital Flow Analysis, it is the size and direction of net change in sector holdings of financial assets that is important in explaining capital market supply and demand.
Understanding Sector Tables
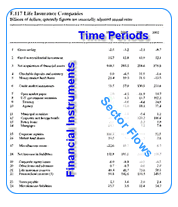
Sector tables show net transfers of financial assets and liabilities for a particular economic group, such as households or commercial banks, over a specific period, usually a year or a quarter.
Sector tables can be thought of as a description of shifts in the allocation of financial assets for a particular sector over a period.
 A sector flow table
For example, the flow of funds table for households (a sector) will show changes in financial assets owned by households over a period.
The rows on the flow table for a sector refer to categories of financial assets, such as equities, bonds, and bank deposits.
The columns on a flow table refer to time periods, such as quarters or years.
The numbers at the intersection of columns and rows represent net changes in holdings of that type of financial asset for that sector over the period.
If we look up the flow table for the household sector we will find net changes in bank deposits held by U.S. households for every year since 1945.
Changes in holdings of assets are called 'flows' and are similar to flow of funds accounts in ordinary financial reporting.
Sector tables are divided into three sections, from top to bottom:
- NIPA Data: One or more rows of macro-economic data related to the National Income and Product Accounts. In our color-coded system, the titles in the left column are shown against a white background.
- Financial Applications: Multiple rows showing net changes in holdings of various categories of financial assets. In our color-coded system, the titles in the left column are shown against a light blue background.
- Liabilities and Equity: Multiple rows showing net changes in sector liabilities and net worth. In our color-coded system, the titles in the left column are shown against a light yellow background.
Understanding Instrument Tables
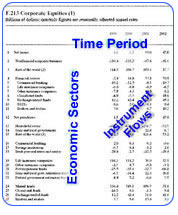
Instrument tables show net shifts in ownership among sectors for a particular type of financial instrument, such as corporate equities or bonds, over a specific time, usually a year or a quarter.
 An instrument table
The instrument tables can be thought of as a description of net purchasers or sellers of a particular financial instrument over a period of time.
For example, flow of funds tables for corporate equities (an instrument) show which sectors were buyers and which were sellers of equities during the period, and the net change in position of each of these sectors.
The rows on the flow table for an instrument refer to sectors, such as households, commercial banks, and insurance companies.
The number at the intersection of a column and a row represents the net flows for that instrument with respect to a specific sector over the period.
If we look up the flow table for the instrument 'corporate equities' we can find the net change in the amount of corporate equities held by insurance companies in any year since 1945.
Sector tables and instrument tables are complementary, one being, essentially, the reverse of the other.
Instrument tables are divided into two sections, from top to bottom:
- Issuers: One or more rows of data showing net issues of this category of instrument by sector. In our color-coded system, the titles in the left column are shown against a light rose background.
- Purchasers: Multiple rows of data showing net purchases of this category of instrument by sector. In our color-coded system, the titles in the left column are shown against a light green background.
The Difference Between Flow and Level Tables
For most (but not all) flow tables, there is a corresponding level table that shows the value of the balances for each item at the end of each period.
If the Federal Reserve Flow of Funds Accounts were constructed according to general accounting principles, the amounts in the flow tables would be equal to the difference between the balances in sequential level tables.
However, some balances are not shown at historical value but at market value. (This is the case for corporate equities.)
Sometimes, there are statistical discontinuities between sequences of level tables.
Furthermore, sector tables are a combination of National Income and Product Accounts statistics, based on macro-economic concepts, and other series that are derived from ordinary accounting data.
Selecting the Most Relevant Tables
Capital Flow Analysis tries to explain supply and demand in securities markets, by focusing on issuers and purchasers of stocks and bonds.
Some tables in the national flow of funds accounts are not useful for this purpose.
For example, tables on net inter-bank transactions may be of interest to students of monetary policy but are of less use in explaining supply and demand for securities in capital markets.
Other tables, such as the derivation of measures of personal savings, are of interest to macro-economists.
On this web site, we have selected thirty tables that are most relevant to Capital Flow Analysis.
Selected Instrument Tables
We have selected the following instrument tables for color-coding on this site:
Equity Instruments:
Fixed Income Instruments:
F.206 Money Market Mutual Fund Shares
F.211 Municipal Securities and Loans
This selection of financial assets represent the primary categories of securities that are bought and sold in the U.S. capital market.
Before proceeding, check your progress:
Self-Test
Flow tables can be distinguished by:
|
|
Rows on sector tables are grouped into the following categories of data:
|
|
The national flow of funds accounts contain the following types of tables:
|