Paradox?: Despite Massive Selling, Equity Positions Hold Steady
by John Schroy filed under Equities, Corporate Managers, Individual Investors
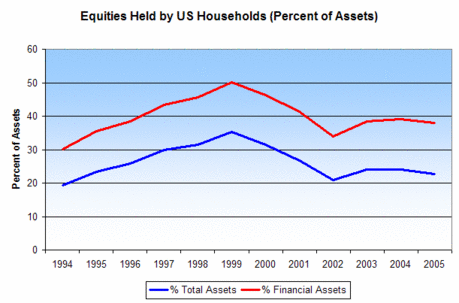
According to Federal Reserve flow of funds table B100e, ownership of equities, as a percent of total household assets has ranged from 20% to 25% since 2002 — about the same level as in 1994-1995, before the speculative bubble over the turn of the century.
How can this be? Flow of funds table F100 shows that net sales of equities by households were over 2 trillion dollars since 2000.
With prices falling after the market peaked in 2000 and with massive net sales of stocks indicated by the Federal Reserve flow of funds accounts, how can the percentage of assets represented by stocks still be about the same as in 1995?
The graph shows equity holdings by US households as a percentage of total assets and financial assets over the last decade.
 Paradox? Steady % of Household Assets Despite Heavy Stock Sales
|
||
The Paradox Explained
The apparent paradox of selling without reducing holdings is resolved by answering this riddle:
How can you sell stock and still have the same position as before you started to sell?
The answer is simple:
You sell stocks that don’t belong to you (short-selling) or that you never owned (exercising options).
As suggested in the earlier article, “Buybacks + Options + Hedge Funds + Insider Information = Crime?“, the primary explanation for the reported net sales of equities by households in recent years has been the exercise of executive stock options, and short-selling by hedge funds and speculators.
Exercising Options: When an executive exercises a stock option, he buys a stock he never owned for one price and then sells the stock for a profit. This appears on the flow of funds accounts as a net sale of stocks. With corporations buying back their own stock, the amount of stock outstanding remains about the same.
Short-Selling: When a hedge fund sells stock short, they do so by borrowing stock from someone else to settle the initial transaction, and then buying back the stock when prices fall, realizing a profit that appears as a net sale of stocks.
Since there are indications that stock options and short-selling have been of an order of magnitude that explains the net sales of two trillion in equities over the last five years, it seems that the paradox is explained.


