On August 3, 2020, by a vote of 93 to 5, the US Senate passed the “Pension Protection Act of 2006″, already approved by the House of Representatives on July 28, 2020 and now going to President Bush to be signed into law.

This massive bill (907 pages) is a major piece of legislation that, like ERISA in the 1970s, will effect capital flows in the US market over the next generation.

Links to the full text of this law and related discussions can be found on BenefitsBlog.

A Boon For Wall Street?

The Wall Street Journal has already headlined some of the expected effects on capital flows.

In the lead editorial on August 4, 2020, “The Pension Era, R.I.P.”, the Journal announced that this law “signals the end of the old, defined-benefit pension era.”

In an article on August 7, 2020, the WSJ announced, “Pension Bill Promises Windfall for Fund Firms”, citing research by the Vanguard Group projecting an additional 5.5 million new savers in 401(k) plans.

The article also states that passage of the bill was helped along by heavy lobbying by the mutual fund industry trade organization, the Investment Company Institute. The Act allows, but does not require, automatic enrollment in 401(k) plans and permits employers to give “investment advice” to plan participants.

The Law of Unintended Consequences

History suggests that a law as complex as the Pension Protection Act of 2006 is likely to be laced with obscure provisions that will have unintended consequences.

More »

divider

Repurchases of company stock, mostly under the safe harbor exemption from market manipulation provided by SEC Rule 10b-18, set an all time record of $366 billion (net) in 2005. This was 260% of levels in 2004 and 880% of buybacks in 2002.

Despite extremely aggressive tactics of corporate management to manipulate stock prices upwards and give value to option and bonus plans, stock prices rose only about 3% in 2005, on average.

Federal Reserve national flow of funds accounts of corporate equities (Table F213) show why stock buybacks were less effective in boosting prices than in the past:

  1. Individuals (U.S. Households) sold, on balance, $501.1 billion in equities in 2005 — mostly executives cashing in on option remuneration plans. This was a record sell-out, twice the level of 2004. Obviously, direct holders of equities did not have as optimistic an outlook for equity prices as did Wall Street touts.

  2. Foreign corporations sold a record net $137.5 billion of new issues into the U.S. market, taking advantage of the over-pricing of U.S. equities engendered by buyback programs. Over-valued stocks mean lower capital costs to companies that are building for the future.

Meanwhile, as executives used stock buybacks to pay themselves, they continued to short-change long-term investors. Cash dividends fell to the lowest level in five years: $234.8 billion.

Not surprisingly, Wall Street firms with special 10b-18 departments reported record profits in 2005.

Long-term, unsophisticated investors, trusting to mutual funds through 401(k) and other tax deferred retirement plans, continued unaware of the massive looting of their savings. (See: Essays on Stock Buybacks and Options), while the SEC looked away, even encouraging this type of market manipulation.

divider

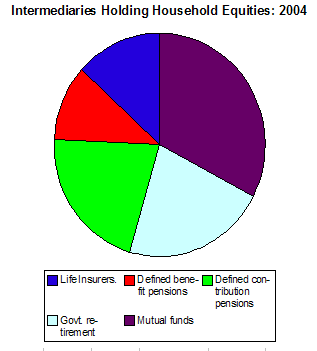
Over 55% of corporate stock that belongs to U.S. Households and Nonprofit Organizations is held indirectly through intermediaries who hold the power to vote these shares.

As of December 2004, according to the Federal Reserve Flow of Funds Account Table B100e, this indirect stock ownership was divided among five major categories of intermediaries, by market value:

  1. Life Insurance Companies: ($1,028.9 billion), as pension reserves, mainly individual and group annuities.
  2. Defined Benefit Private Pension Funds: ($859.9 billion), mainly corporate pension plans.
  3. Defined Contribution Pension Plans: ($1,656.3 billion), mainly 401(k) and similar company plans.
  4. State, Local, and Federal Government Retirement Funds: ($1,706.3 billion), mainly defined-benefit pension plans for state and local governments.
  5. Mutual Funds: ($2,531.6 billion), mainly as Individual Retirement Accounts.

The graphs shows how indirect holdings of equities belonging to Households and Nonprofit Organizations were divided among these categories of intermediaries in December 2004:

Intermediaries Holding Stock Proxies
 
divider

copyright | privacy | home

Powered by WordPress | Entries (RSS) | Comments (RSS)