On April 1, 2020, the financial news trumpeted that the FASB was taking, as Andrei Postelnicu put it in the Financial Times, ’significant steps in reforming the way companies report pension liabilities.’

The Financial Times article (FT.com, April 1, 2020) goes on to say,

‘The move aims to increase the transparency of financing for certain pension plans and replace a system in which the balance sheet “almost always” fails to reveal the true state of those benefit plans, according to the Financial Accounting Standards Board.’ However, this change in accounting standards only represents a further slow tightening of the screws regarding the way pension liabilities are reported — a step in a long, excruciating journey that has been underway for decades.

According to this summary on the FASB website:

FASB Concepts Statement No. 5, Recognition and Measurement in Financial Statements of Business Enterprises, paragraph 2, indicates that “the Board intends future change [in practice] to occur in the gradual, evolutionary way that has characterized past change.”

The GASB is taking similar, but not identical steps in requiring more truthful accounting of public pension funds.

More »

divider

Over 55% of corporate stock that belongs to U.S. Households and Nonprofit Organizations is held indirectly through intermediaries who hold the power to vote these shares.

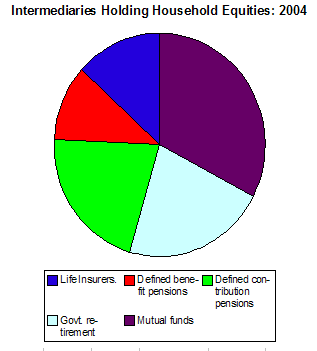
As of December 2004, according to the Federal Reserve Flow of Funds Account Table B100e, this indirect stock ownership was divided among five major categories of intermediaries, by market value:

  1. Life Insurance Companies: ($1,028.9 billion), as pension reserves, mainly individual and group annuities.
  2. Defined Benefit Private Pension Funds: ($859.9 billion), mainly corporate pension plans.
  3. Defined Contribution Pension Plans: ($1,656.3 billion), mainly 401(k) and similar company plans.
  4. State, Local, and Federal Government Retirement Funds: ($1,706.3 billion), mainly defined-benefit pension plans for state and local governments.
  5. Mutual Funds: ($2,531.6 billion), mainly as Individual Retirement Accounts.

The graphs shows how indirect holdings of equities belonging to Households and Nonprofit Organizations were divided among these categories of intermediaries in December 2004:

Intermediaries Holding Stock Proxies
 
divider

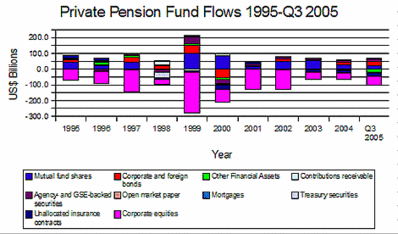
The Federal Reserve Flow of Funds Table F118 (Private Pension Funds) shows that this sector continues its long-term pattern of selling equity positions and buying mutual funds.

This graph shows the investment behavior of private pension funds over the decade 1995-2004, compared with the recent data for Q3 2005.

How Are Private Pensions Investing?

The graph reveals a marked flurry of portfolio activity in 1999, with heavy selling of equities in the year preceding the crash of August 2000.

After the crash of 2000, portfolio turnover for private pension funds diminished, although the pattern of selling equities and buying mutual funds continued.

This sector includes both defined benefit and defined contribution plans as well as 401(k) arrangements.

 
divider

copyright | privacy | home

Powered by WordPress | Entries (RSS) | Comments (RSS)