The US Federal Reserve flow of funds accounts for Q2 2009 provide a clear explanation of the causes of the recovery in stock prices in the first half of 2009.
These statistics show a pattern of behavior quite different from that which has prevailed since 1982.
It is too early to say whether Q2 2009 is the precursor of a new paradigm in US equity markets, or whether the Stock Buyback Era will return.
The (temporary?) demise of stock buybacks
For the last twenty years, the upward trend in the US equity markets has been driven by massive net stock buybacks on the part of non-financial corporations, matched, more or less, by huge net sales of equities by US households as corporate executives exercised stock options in amounts that far exceeded net stock investments by other individual investors.
|
|
|
|
New York City skyline in 1970s, before the Buyback Era began ...
|
|
|
|
|
During this period, prices moved upwards, which, according to the Motivation Axiom of Capital Flow Analysis, meant that corporate buybacks were causing the upward movement in stock prices.
In Q2 2009, this flow pattern was suddenly reversed — returning to a type of behavior seen prior to 1982 when the US SEC issued Rule 10b-18 granting safe harbor to corporations that wished to manipulate stock prices in order to give value to executive stock options.
The stock buyback movement has been, essentially, a trillion dollar Ponzi scheme that required ever greater gobs of corporate cash to succeed.
The Crash of 2000 signaled the first weakening in the buyback movement, as a point was reached where buybacks could no longer be easily financed just from current earnings.
The post-2000 recovery came about as corporations began to finance buybacks by dipping into depreciation reserves and, in the last five years, by borrowing from banks.
In 2007, the collapse of the sub-prime mortgage market began to restrict the availability of credit.
By the last quarter of 2008, imprudent bank lending had reached such proportions that global financial markets collapsed, bringing what seemed to be, the end of the buyback era.
Capital Flow Analysis made it possible to predict the 2008 collapse in equity prices as far back as September 2007.
Now the pattern has changed.
Radical shifts in market behavior in Q2 2009
Federal Reserve flow of funds table F.213 shows the dramatic difference in the equity market in 2007 (before the Crash) and in Q2 2009 (after the Crash):
Federal Reserve Release Z.1 (F.213 Corporate Equities)Green = net buyers; Red = net sellers.
| US$ billions (Annual rates) |
2007 |
Q2 2009 |
| Issuers of securities |
|
|
| Domestic, non-financial corporations |
-790.1 |
88.0 |
| Foreign corporations |
147.8 |
148.9 |
| Domestic financial corporations |
28.1 |
55.0 |
| Exchange-traded Funds |
149.9 |
149.0 |
| Total Issuers |
-464.3 |
440.9 |
| Purchasers of securities |
|
|
| Households |
-794.2 |
288.1 |
| Federal government |
0.0 |
-127.9 |
| Foreign investors |
218.5 |
114.6 |
| Life insurance companies |
84.1 |
15.4 |
| Private pension funds |
-217.0 |
-170.6 |
| State, local govât pension funds |
-35.3 |
2.8 |
| Mutual funds |
91.3 |
225.7 |
| Closed-end funds |
18.7 |
-7.9 |
| Exchange-traded funds |
137.2 |
106.7 |
| Broker-dealers |
25.4 |
-30.1 |
| Miscellaneous purchasers |
7.0 |
24.1 |
| Total Purchasers |
-464.3 |
440.9 |
This table shows a striking shift in market behavior pre- and post-Crash.
Before the Crash, Domestic, Non-Financial Corporate issuers were net buyers of securities; after the Crash, these corporations were net sellers.
The 2007 pre-Crash flows were typical “buyback era” behavior — exactly the opposite of issuer behavior one might expect from Economics 101 in which corporations are supposed to go to the stock markets to raise capital.
After the crash, Issuers became “net sellers” and investors became “net purchasers” — which is what one would expect from Economics 101.
In Q2 2009, stock prices were rising and the principal buyers were individuals, directly as Households, and indirectly through Mutual Funds.
According to the Motivation Axiom, this means that the behavior of individual investors was the driving force that caused stock prices to rise in the first half of 2009.
By analyzing the flow of funds accounts for Households, we see that individual investors were moving out of fixed income investments into stocks, apparently due to low interest rates on short-term investments and fear of the impact of inflation on longer-term bonds.
What else can be deduced from Q2 2009 equity flows?
From the above table, other patterns can be discerned, beyond the shift of motivated buyers from domestic, non-financial corporations to households and mutual funds (individual investors).
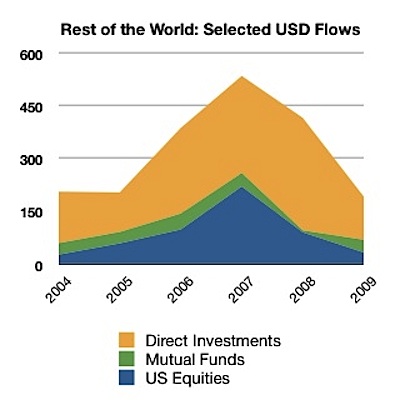
- Rest of the world: Foreign corporations continue to use the US capital market as a source of funds (sellers of equities). However, the willingness of foreign investors to buy into the US equity markets has dropped significantly relative to 2007.
- Federal government: The US government is now a major player in the US equity markets. However, the government has not entered directly onto the stock exchanges, preferring direct deals with corporations. In Q2 2009, the government reduced their equity positions (net sellers) as companies sought to rid government from their lists of shareholders. The prices at which these transfers took place were not determined by supply and demand on the open market.
- Sophisticated investors: Insurance companies and broker-dealers tend to be more sophisticated in their investments than individual investors, acting directly (households) or indirectly through mutual funds. Sophisticated investors showed a reduced appetite for equities, despite rising prices. In the case of broker-dealers, activity shifted sharply towards net selling compared to their position as net buyers in 2007. This suggests that institutional investors might have been skeptical of the sustainability of the 2009 recovery in equity prices.
- Private pension funds: These long term investors have been strong sellers of equities since before the crash, indicating an excess of withdrawals over new investment in pension plans. As Baby Boomers retire in greater numbers, private pension funds might be expected to continue to be a drag on equity price levels.
These indicators suggest that the more sophisticated institutional investors have been avoiding US equities and that a furtherance of the 2009 price bounce may depend upon the motivation of less knowledgeable individual investors.
Risk of investment in equities increases substantially
For a generation prior to the Crash of 2008, with equity prices being driven primarily by corporate stock buybacks, investors could rely, over the medium term, in a continued rise in stock values.
The motivation the caused corporations to buyback their own stocks (at the expense of dividends and to the detriment of long-term investors) was pure, selfish greed, without a trace of fiduciary responsibility. This crass motivation proved extremely reliable, as seen by the behavior of top executives in saving their own remuneration schemes during the Crash of 2008, despite public outcries and the woes of ordinary investors.
However, if the buyback era is over — which is not yet certain — investors will have to get back to fundamentals and try to determine the intrinsic value of securities before trusting their life savings to a portfolio of equities.
This is easier said than done, since the market has changed since the days of Graham & Dodd.
Many unsophisticated investors still believe in the Efficient Market Hypothesis, as demonstrated by the continued high level of investment in Exchange Traded Funds.
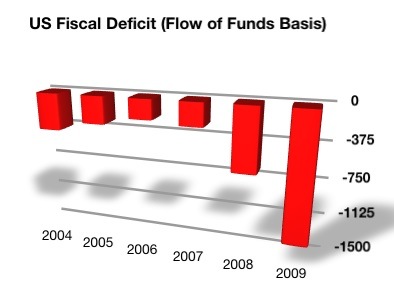
Furthermore, the extreme, radical changes in the US economy being introduced by the Obama administration and the Democrat Party that controls the US Congress, with an outlook of fiscal deficits beyond anything most investors have seen in a lifetime (except in third world countries), combined with expectation of massive tax increases on most of the population (directly and indirectly), creates foreboding in the minds of most Americans (at least those who own stocks) as to the future of the country.
Furthermore, the are technical barriers to a continued recovery in stock prices, including:
- Over-hang of executive stock options: Corporate executives are still holding huge quantities of under-water stock options (perhaps on the order of a trillion dollars) that will be triggered if stock prices ever get back to 2007 levels.
- Rising interest rates: Sooner or later, the Federal Reserve will have to give up on trying to artificially hold down interest rates. When inflation kicks in, interest rates on money market funds will rise substantially, as happened in the Jimmy Carter years. At some point, investors will opt out of risky long-term investment in equities and move to tangible returns in the form of high interest rates.
- Persistent high unemployment and tight credit: Motivation towards increased personal savings are stimulated by high unemployment and tight credit. As seen in Q2 2009, personal savings rates have already risen substantially, causing savings to be channeled into equities, in lieu of extremely low interest on money market funds and bank time deposits. However, once interest rates start to rise and inflation kicks in, these savings may be moved out of equities into what is perceived as safer investments.
- Tendency to cash out of equities, once pre-Crash levels are reached: Most individual investors saw their net worth decline by twenty percent or more in the Crash of 2008 and many of these are approaching or are in their retirement years. Chances are that if stock prices ever get up to pre-Crash levels, these investors will be strongly tempted to cash out — placing a barrier to further recovery in prices.
In any event, uncertainty as to the future of equity prices has risen to the highest levels in a generation and uncertainty is just another name for risk.
Weâll see …


 Click these icons to email articles to friends.