The Milken Institute debate that was highlighted in an earlier article, Common Stock Legend Disavowed: Professor Siegel’s Epiphany, brought into focus two opposing views regarding the possible negative impact on stock prices to be caused by the retirement of the Baby Boomer generation.

Michael Milken, the Chairman of the Institute, took an optimistic stance, suggesting that the problem would probably resolve itself through improvements in technology and productivity enhancements.

Linking economic stability and growth to enhanced productivity and new technology is a popular theme among economists, including ex-Federal Reserve Chairman Alan Greenspan.

Productivity and Technology Can’t Save the Baby Boomers

As described in the essay, “Profits and Population“, American economic growth over the last fifty years has had more to do with the expansion of the number of people working in the money economy than with advances in technology and productivity.

The initial impact of productivity improvements and new technology is to put people out of work.

Unless government policy and societal customs encourage education, savings and investment, and entrepreneurial activity, higher paying new jobs will not be created fast enough to employ workers displaced by productivity enhancement and new invention.

More »

divider

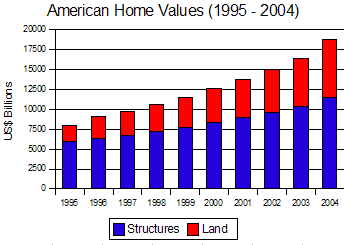
Over the decade 1995 - 2004, the market value of residential real estate increased, on average, about 10% a year. (See: Federal Reserve Flow of Funds Table B100.)

The same table shows that the replacement cost of America’s homes, rose, on average, only about 7.6% a year.

If these estimates are reasonably correct, we can deduce that the value of the land on which American homes are built increased, on average, about 15.6% a year, over the decade.

The graph, drawn from this data, shows how overall residential real estate values changed over the period 1995 - 2004.

American Homes: Land vs. Buildings

Over the decade, the imputed value of land as a percentage of total residential property values, rose from 25% to 38%. (Note: The imputed value of land is the market value of residential real estate less the cost of replacement of structures.)

Taking into consideration home equity values (market value less mortgages), land values increased from a 43% share to a 64% share, on average, of home equity values.

Since these figures represent averages for the entire nation, we may conclude that in some sections, land values are still around 20% of residential property values, whereas in other areas, land values may be higher than 60% of property values.

More »

 
divider

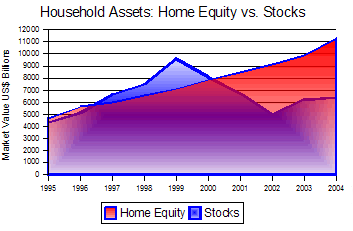
In 1995, U.S. households held similar amounts of assets in home equity and corporate stocks: US$4.3 trillion in stocks and US$4.7 trillion in home equity. (See: Federal Reserve Flow of Funds Table B100.)

Over the decade, the situation changed dramatically, so that by 2004, households held US$4.8 trillion more in home equity than in corporate stocks, as the graph shows.

Home Equity vs. Stock Holdings

This difference came about because of the crash in the stock market in 2000-2001 and because of the steady increase in home values throughout the decade.

[Note: ‘Home Equity’ is calculated by subtracting home mortgages from the market value of residential property owned by this sector.]

 
divider

copyright | privacy | home

Powered by WordPress | Entries (RSS) | Comments (RSS)