As the graph below shows, there has been a boom in the sale of new, single-family homes in the US since the late 1990s.

In recent weeks, common wisdom bandied about on financial talk shows is that this housing boom was somehow caused by Federal Reserve Chairman Greenspan’s reduction in short-term interest rates during the years 2000-2004.

But is this reasonable?

Might there not be some other explanation?

Consider Demographics Rather Than Interest Rates

The thing that strikes me about the graph of new home sales (besides the boom of the late 1990s) is that the addition of new homes to the US housing supply has been more or less stable for over thirty years, fluctuating around only 600,000 new homes a year.
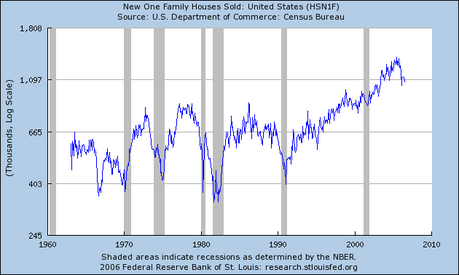
New Home Sales Began To Take Off in the 1990s

In 1999, the stock of single family homes in the US was about 112 million units. That means that the supply of new homes, for over thirty years, was less that one percent of the number of homes in use at the end of the century.

New Immigrants and Internal Migrants Need Homes

Compare this to the statistics on legal immigration, which, since the end of World War II, has grown from about one million a year, to over nine million a year by 2000. See the graph in the article, “America Grows With Legal Immigration“.

More »

 
divider

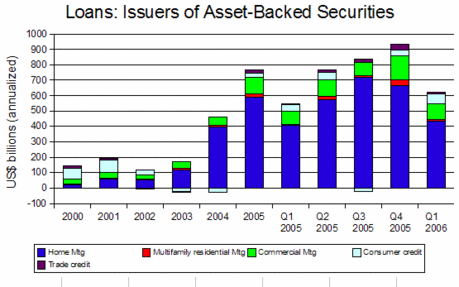
After having the market for mortgage securitization virtually to themselves, while Fannie Mae was in the regulatory doghouse, issuers of asset-backed securities again faced fierce competition as government-sponsored enterprises returned with a vengeance to the market. (See: Agency Bond Issuance Recovers: Q1 2006)

The graph, based on Federal Reserve flow of funds table F126, shows how, after 2003, issuers moved aggressively into the mortgage securitization market, taking over the market space occupied by Fannie Mae:

Loans made by Issuers of Asset-Backed Securities

In Q1 2006, with the return of Fannie Mae, there was a noticeable drop in the volume of loans by issuers of asset-backed securities.

Competition Increases

Having had two years to build a position in this market segment, perfecting loan origination methods and distribution channels, issuers of asset-back securities are not likely to surrender these gains without a fight.

Basically, we now have two clashing sectors in the mortgage securitization market: the government-sponsored agencies (with the political backing of the Democratic Party), and the issuers of asset-backed securities, mainly supported by the private commercial banking sector.

Although it is too soon to say with certainty, this increased competition may result in a greater supply of securitized mortgage paper, which, in turn, would help to depress bond prices, while driving interest rates higher, all other things being equal (which they never are).

 
divider

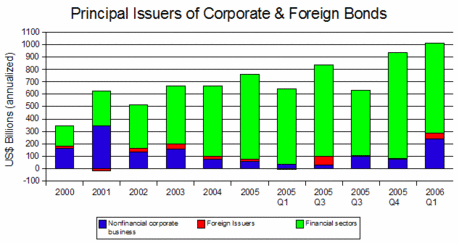
Massive issuance of bonds by non-financial corporations, largely to finance an extraordinary level of stock buybacks, helped force bond interest rates upwards in Q1 2006. (See Flow Table F212).

The annualized rate of bond issuance by non-financial corporate business rose to $240.4 billion in Q1 2006, four times the issuance rate of 2005.

The graph shows that, for years, the principal issuers of corporate bonds into the U.S. market have been the financial sectors (green bars) — mainly issuers of asset-backed securities raising funds for mortgages and consumer finance.

Principal Issuers of Corporate & Foreign Bonds

Non-financial Corporations Raise Money For Buybacks

The annualized rate of issuance of corporate bonds by the financial sectors rose from $679.3 billion in 2005 to $725.4 billion in Q1 2006, while the financial sector’s share of the issuance market fell from 90% to 70% due to the extraordinary level of bonds issued by non-financial corporations.

More »

 
divider

copyright | privacy | home

Powered by WordPress | Entries (RSS) | Comments (RSS)