Did the Fed Really Cause the US Housing Boom?
by John Schroy filed under Agencies, Mortgages, Equities, Individual Investors, Foreign Investors, Economic Theory, Bankers, Brokers
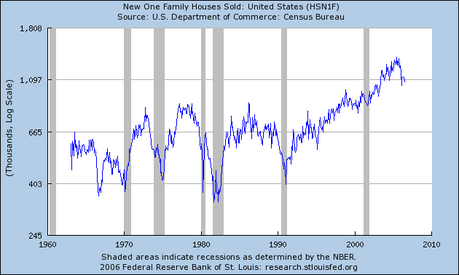
As the graph below shows, there has been a boom in the sale of new, single-family homes in the US since the late 1990s.
In recent weeks, common wisdom bandied about on financial talk shows is that this housing boom was somehow caused by Federal Reserve Chairman Greenspan’s reduction in short-term interest rates during the years 2000-2004.
But is this reasonable?
Might there not be some other explanation?
Consider Demographics Rather Than Interest Rates
The thing that strikes me about the graph of new home sales (besides the boom of the late 1990s) is that the addition of new homes to the US housing supply has been more or less stable for over thirty years, fluctuating around only 600,000 new homes a year.
 New Home Sales Began To Take Off in the 1990s
|
||
In 1999, the stock of single family homes in the US was about 112 million units. That means that the supply of new homes, for over thirty years, was less that one percent of the number of homes in use at the end of the century.
New Immigrants and Internal Migrants Need Homes
Compare this to the statistics on legal immigration, which, since the end of World War II, has grown from about one million a year, to over nine million a year by 2000. See the graph in the article, “America Grows With Legal Immigration“.


