As the graph below shows, there has been a boom in the sale of new, single-family homes in the US since the late 1990s.

In recent weeks, common wisdom bandied about on financial talk shows is that this housing boom was somehow caused by Federal Reserve Chairman Greenspan’s reduction in short-term interest rates during the years 2000-2004.

But is this reasonable?

Might there not be some other explanation?

Consider Demographics Rather Than Interest Rates

The thing that strikes me about the graph of new home sales (besides the boom of the late 1990s) is that the addition of new homes to the US housing supply has been more or less stable for over thirty years, fluctuating around only 600,000 new homes a year.
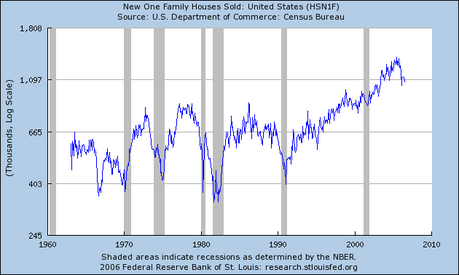
New Home Sales Began To Take Off in the 1990s

In 1999, the stock of single family homes in the US was about 112 million units. That means that the supply of new homes, for over thirty years, was less that one percent of the number of homes in use at the end of the century.

New Immigrants and Internal Migrants Need Homes

Compare this to the statistics on legal immigration, which, since the end of World War II, has grown from about one million a year, to over nine million a year by 2000. See the graph in the article, “America Grows With Legal Immigration“.

More »

 
divider

It used to be that the term ‘international liquidity’ meant the relative amount of resources available to a nation’s monetary authorities that could be used to settle a balance of payments deficit.

In the days of the gold standard, this would mean access to gold that could be used to redeem a nation’s currency held by foreigners.

After Breton Woods and the advent of the dollar-gold exchange standard, liquidity came to mean access to dollars, either held as reserves or as credit lines, or the SDR system maintained by the International Monetary Fund.

After 1971, with the abandonment of the dollar-gold exchange standard, as the world entered an era of ‘managed’ exchange rates, some ‘floating’, some ‘pegged’, ‘international liquidity’ came to mean the resources available to national monetary authorities to maintain the value of their currencies as required by their exchange management programs.

More »

divider

The correct answer to this question is, “Of course, the U.S. trade deficit is not sustainable.”

But then, what is? Neither the Roman nor the British Empire endured. Economic and political phenomenon eventually fade and die. Indeed, the U.S. trade deficit, one day, like everything else will be a thing of the past.

A more practical question would be, “How much longer might the U.S. trade deficit last? One year? Ten years? Thirty years?”

Some observers may presume that the demise of the trade deficit is imminent, perhaps by the end of 2006; but, it this reasonable?

The trade deficit has been growing for thirty years — which almost qualifies as a Keynesian ‘long-run’ . Since no clear mechanism exists whereby the trade deficit must end in, say, six months or a year, it could be that in thirty years our children will still fret about a trade deficit that has grown even larger.

The longevity of the U.S. trade deficit is quite germane to Capital Flow Analysis, since it is the dollars earned by foreign exporters that support the price of American bonds.

(See: “Trade Deficits Have Depressed Bond Yields for Twenty Years.”)

It is worthwhile to speculate about the sustainability of the trade deficit.

More »

divider

copyright | privacy | home

Powered by WordPress | Entries (RSS) | Comments (RSS)